Summary
Despite elevated geopolitical tensions and the continued closure of the Strait of Hormuz, equities have climbed back to all-time highs as investors refocus on the strength of corporate earnings and the broader economic backdrop. Companies are beating profit estimates at an unusually strong pace, while earnings growth has accelerated to levels rarely seen outside of post-recession recoveries.
Historically, strong and rapid market advances have tended to occur during durable bull markets rather than near major market peaks. The recent rally has already produced several rare momentum signals, including one of the strongest three-week rallies in history and a double-digit gain for the S&P 500 in a single month.
The broader outlook remains constructive, supported by resilient corporate profits, improving margins, and continued investment spending tied to artificial intelligence. At the same time, investors should remember that pullbacks are a normal part of investing. Even during the strong market advance of the past three years, the S&P 500 has experienced multiple declines of 5% or more along the way.
Our microcast™ signal remains at a neutral allocation. Taken together, our tactical risk models continue to indicate a constructive backdrop for equities.
Lingering Geoplotical Risk Has Not Prevented The Market From Reaching New Highs
Despite elevated geopolitical risks and continued uncertainty surrounding the Strait of Hormuz, investor focus has increasingly returned to the resilience of corporate profits and the strength of the underlying earnings backdrop.
Simply put, the profitability of U.S. corporations has remained too strong for investors to ignore. Companies are beating earnings estimates at an 84% rate, while year-overyear earnings growth has reached 25%, a figure rarely seen outside of post-recession recoveries (data from Piper Sandler):

What makes this especially notable is that profit growth continues to strengthen even after an extended period of elevated interest rates. Many investors expected a more meaningful deterioration in corporate earnings by this stage of the cycle.
Over time, equity markets tend to follow the direction of corporate profits. As long as earnings growth remains healthy, the fundamental backdrop for stocks should remain supportive.
With the market at all-time highs and enthusiasm around artificial intelligence continuing to build, it is worth reminding investors that new highs are not bearish signals. Historically, markets have performed just as well following all-time highs as any other day (data from 3Fourteen):

Bull Markets Typically Features Sharp, Powerful Upswings
The scale and speed of the rally since the March 30 low has been reminiscent of the surgefollowing “Liberation Day”, when the Trump administration reversed course on its initialtariff plans in April of last year. In several respects, this advance has been even moreimpressive.
First, the S&P 500 gained more than 10% in a single calendar month, a rare occurrencethat has happened only 13 times since 1950. Historically, stocks have gone on to postsolid gains in the months and years that followed (data from 3Fourteen):

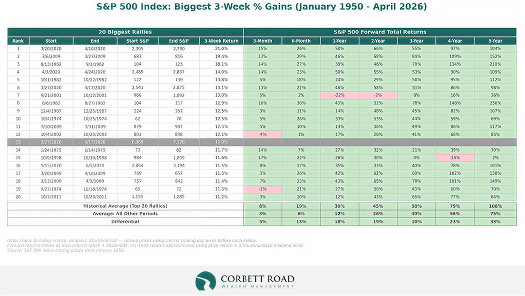
Second, the market experienced one of the strongest three-week rallies in its history,climbing nearly 12% from the end of March through mid-April. Historically, advancesof similar magnitude have rarely occurred near major market peaks (data from CharlieBilello):
Lastly, the rally pushed the market to a year-to-date gain of more than 5% throughApril. Historically, strong starts to the year have not only led to solid returns over theremaining months but have also seen better-than-average returns during the oftenfeared “Sell in May” period spanning May through October (data for next two charts fromCarson):
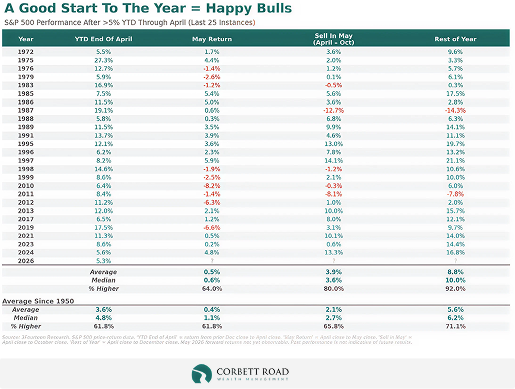
This also serves as a good reminderthat the widely followed “Sell in May”strategy has not been particularlyeffective in recent years:

That should not come as much of a surprise. Market anomalies that become widely knownoften lose their effectiveness over time.
The Outlook Remains Constructive, Even If The Road Ahead Includes Periodic Pullbacks
The combination of positive earnings growth, improving corporate margins, andsignificant capital spending tied to artificial intelligence continues to provide meaningfultailwinds for equities. Importantly, many of those tailwinds have been in place for severalyears.
Over that same period, markets have navigated a wide range of risks, including majorbank failures, tariffs, and now a sharp rise in oil prices. At various points, each appearedcapable of derailing the bull market, yet the broader uptrend remained intact.
It is important to emphasize that this has not been an easy advance to stay investedthrough. Since the start of 2023, the S&P 500 has experienced seven separate pullbacks ofat least 5%, including one decline that approached 20% (data from Bespoke):

It serves as an important reminder that market declines are a normal part of investing,even during strong market advances like the one experienced over the past three years.
In summary, despite higher oil prices and lingering geopolitical tensions, the broadermarket backdrop remains supported by strong corporate earnings, resilient profit margins, and continued investment spending. History suggests that powerful rallies,strong starts to the year, and new all-time highs have more often been characteristic ofdurable bull markets than major market tops. That does not mean the path forward willbe smooth, as periodic pullbacks remain a normal part of investing. But so far, the markethas continued to demonstrate an ability to absorb negative headlines while respondingpositively to strong underlying fundamentals.
Important Disclosures
Corbett Road Capital Management, LLC (“Corbett Road”) is a federally registered investment advisor with the SecuritiesExchange Commission (“SEC”) and has been in business since 2019. Registration with the SEC does not imply their approval orendorsement of any service provided by Corbett Road. This presentation contains information based on the views of CorbettRoad. Other organizations or persons may analyze investments and the approach to investing from a different perspectivethan that reflected in this presentation. Nothing included herein is intended to infer that the approach to investing discussedin this presentation will assure any particular investment results.
Nothing in this presentation is to be considered investment advice and should not be relied upon as the basis for enteringany transaction or advisory relationship or making any investment decision. All investments involve the risk of loss, includingthe loss of principal. Performance information included on this presentation is solely to demonstrate the potential benefitshistorically associated, with commercial asset classes. Past performance is not an indicator of future results.
Charts and graph depicted in this presentation are for educational purposes only. Investors cannot invest in a market indexdirectly, and the performance of an index does not represent any actual transactions. The performance of an index does notinclude the deduction of various fees and expenses which would lower returns. Advisory fees charged to Corbett Road clients,whether directly or indirectly through an ETF, are described in Corbett Road’s Form ADV Part 2A and Form CRS, available athttps://adviserinfo.sec.gov/firm/summary/305063. Past performance is no guarantee of future results.
The presentation includes data, graphs, charts, or other material reflecting the performance of a security, an index, aninvestment vehicle, a composite or other instrument over time (“Performance Material”). Past performance, and anyperformance reflected in Performance Material, is not an indication of future results.
All information is based on sources deemed reliable, but no warranty or guarantee is made as to its accuracy or completeness.macrocast™ and microcast™ are proprietary indexes used by Corbett Road Capital Management to help assist in theinvestment decision-making process. Neither the information provided by macrocast™ or microcast™ nor any opinionexpressed herein considers any investor’s individual circumstances nor should it be treated as personalized advice. Individualinvestors should consult with a financial professional before engaging in any transaction or strategy. The phrase “the market”refers to the S&P 500 Total Return Index unless otherwise stated. The phrase “risk assets” refers to equities, REITs, high yieldbonds, and other high volatility securities.
Use of Indicators
Corbett Road’s quantitative models utilize a variety of factors to analyze trends in economic conditions and the stock market todetermine asset and sector allocations that help us gauge market movements in the short- and intermediate term. There is noguarantee that these models or any of the factors used by these models will result in favorable performance returns.
Individual stocks are shown to illustrate market trends and are not included as securities owned by CRCM. Any names held byCRCM is coincidental. To be considered for investment by CRCM, a security must pass the Firm’s fundamental review process,meet certain internal guidelines, and fit within the parameters of the Firm’s quantitative models.
