Summary
Despite renewed bubble concerns, today’s technology sector still looks nothing like the dot-com era’s. The Nasdaq’s five-year gain is only about one-ninth of the late-1990s surge, and technology stocks are trading at valuations that remain far below the extremes reached in 2000.
The bull market broadened significantly during the first half of 2026. Leadership expanded well beyond the Magnificent Seven as small caps, emerging markets, REITs, commodities, and the average S&P 500 stock all outperformed, suggesting a healthier and more durable rally.
The market staged a strong second-quarter reversal and a solid—but not euphoric—first-half return. Historically, similar price action has led to additional gains, painting a picture more consistent with the middle of a bull market than the end of one.
Our microcast™ signal remains at a neutral allocation. Taken together, our tactical risk models continue to indicate a constructive backdrop for equities.
Charts and graphs depicted in this presentation are for educational purposes only. Investors cannot invest in a market index directly, and the performance of an index does not represent any actual transactions. The performance of an index does not include the deduction of various fees and expenses which would lower returns.
See content within for additional information on the summary items discussed above.
Market Bubble Watch: Still Nowhere Near Dot-Com Levels
Today’s Nasdaq rally is nowhere near as extreme as that of the dot-com bubble. While the Nasdaq-100 has gained an impressive 104% over the past five years, that is only about one-ninth of the roughly 949% advance leading up to the 2000 peak (chart from Bluekurtic):
Nasdaq-100 Rally Remains Below Dot-Com Extremes
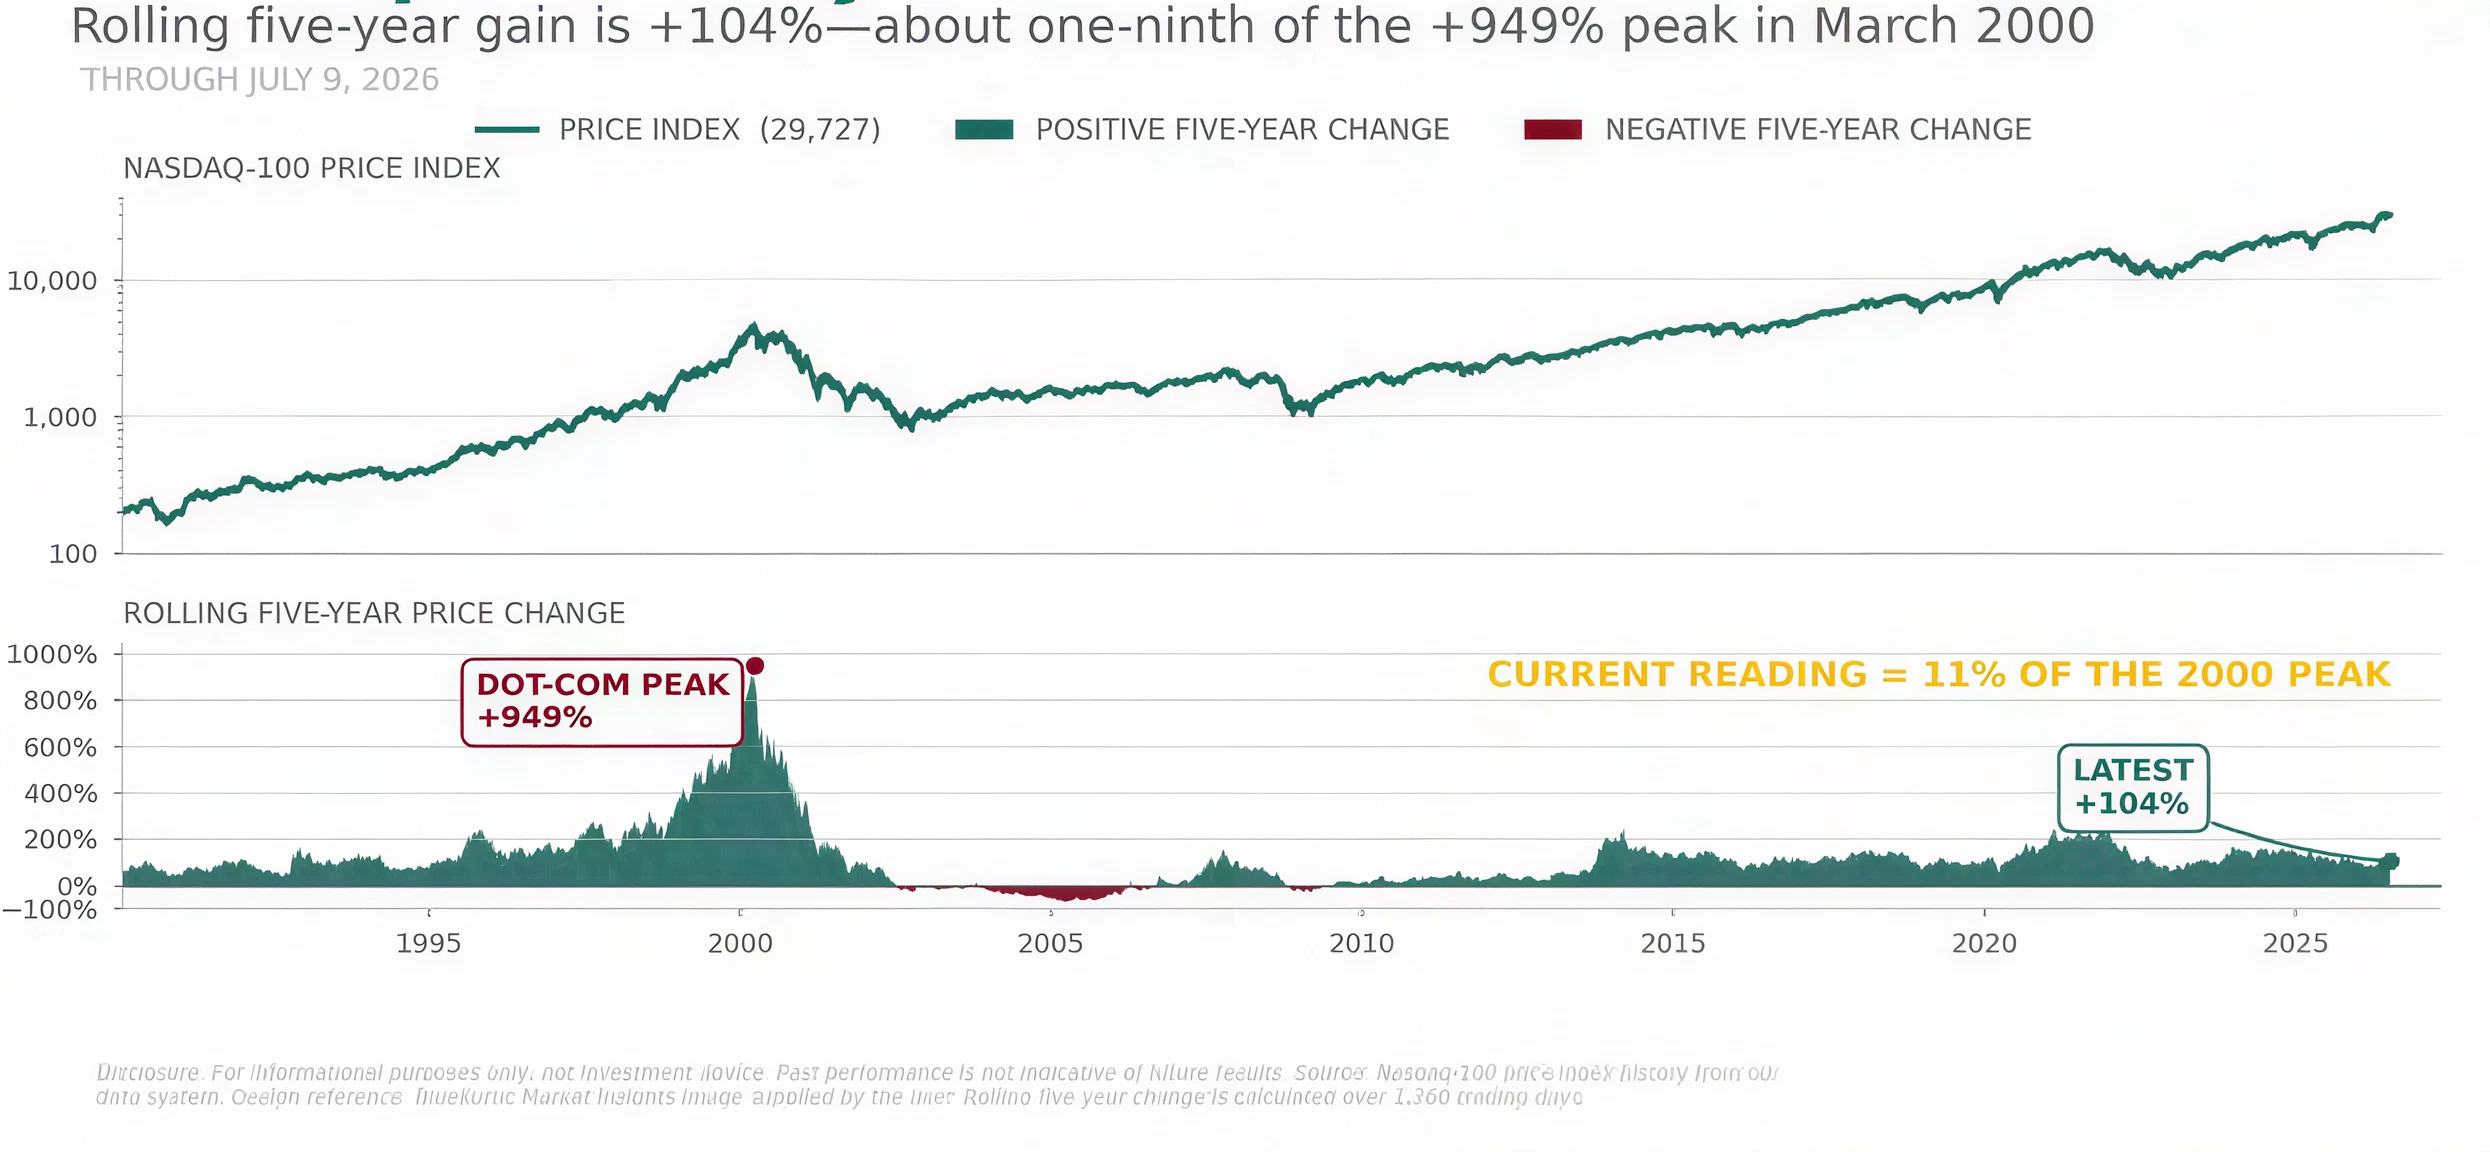
That distinction is critical, as investors and financial media continue to compare today’s enthusiasm for AI-driven technology stocks with the late-1990s bubble. Based on five-year price gains, the current rally still bears little resemblance to the blowoff that preceded the dot-com crash.
What about valuations? Tech valuations also remain well below dot-com extremes. Technology stocks trade at around 22 times expected earnings, roughly 60% below the 55x multiple reached at the peak of the bubble in 2000.
What about the broader market? The valuation gap between tech and the broader market is also far narrower than during the dot-com bubble. Today, the S&P 500 trades at about 20 times expected earnings, versus roughly 25 times at the 2000 peak. This leaves tech at a modest 9% premium to the broader market, compared with roughly 120% at the height of the bubble (data from Yardeni Research):
Tech Valuations Remain Below Dot-Com Extremes
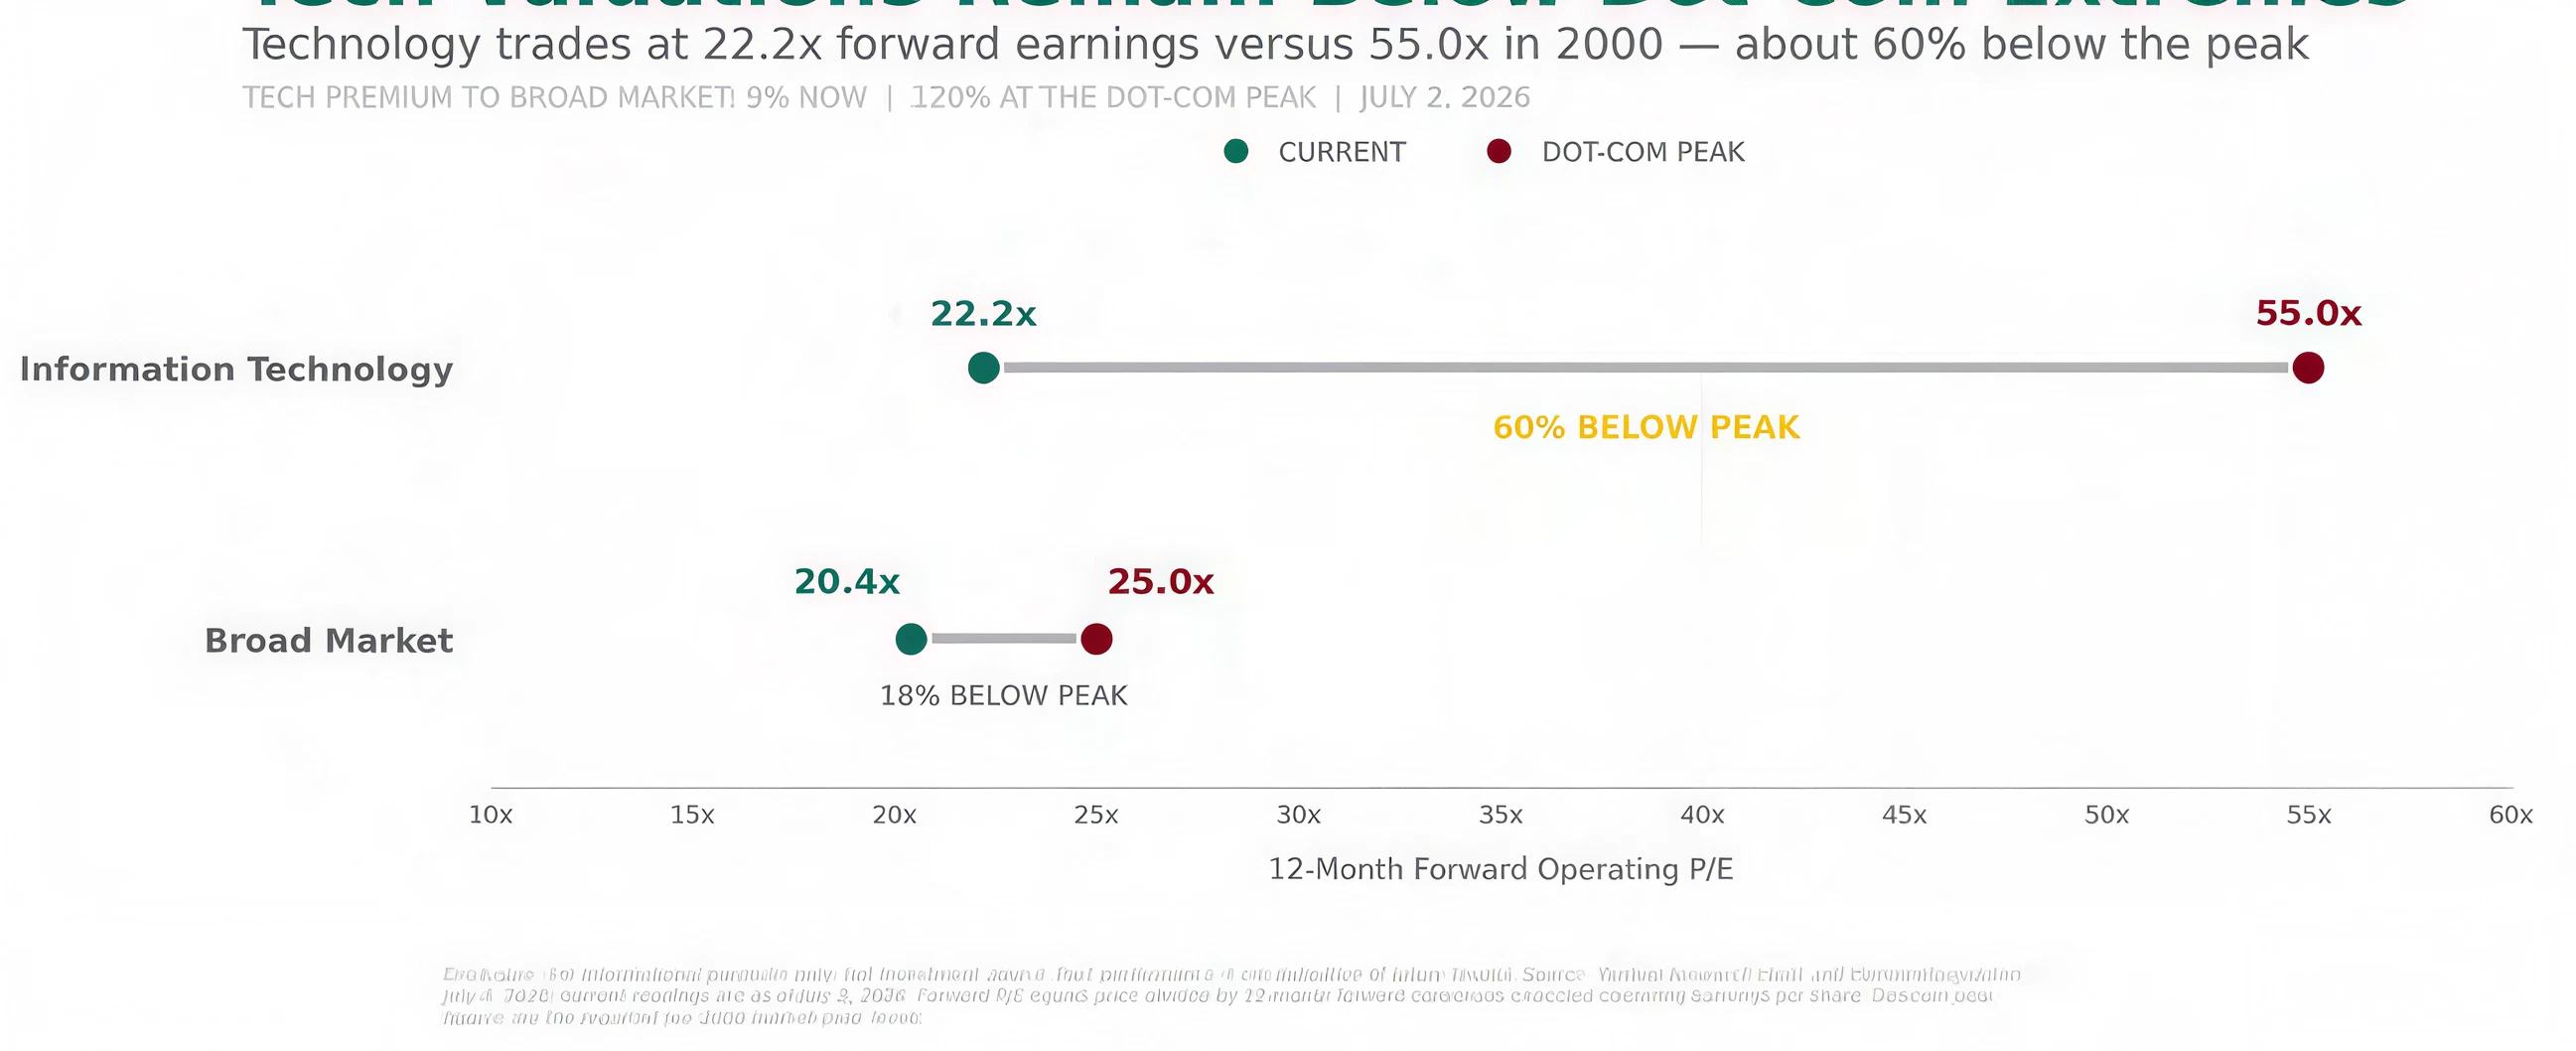
While valuations remain elevated and leave less margin for error, the data once again does not support the view that today’s technology sector is priced anywhere near dot-com levels.
First Half 2026 Asset Class Review
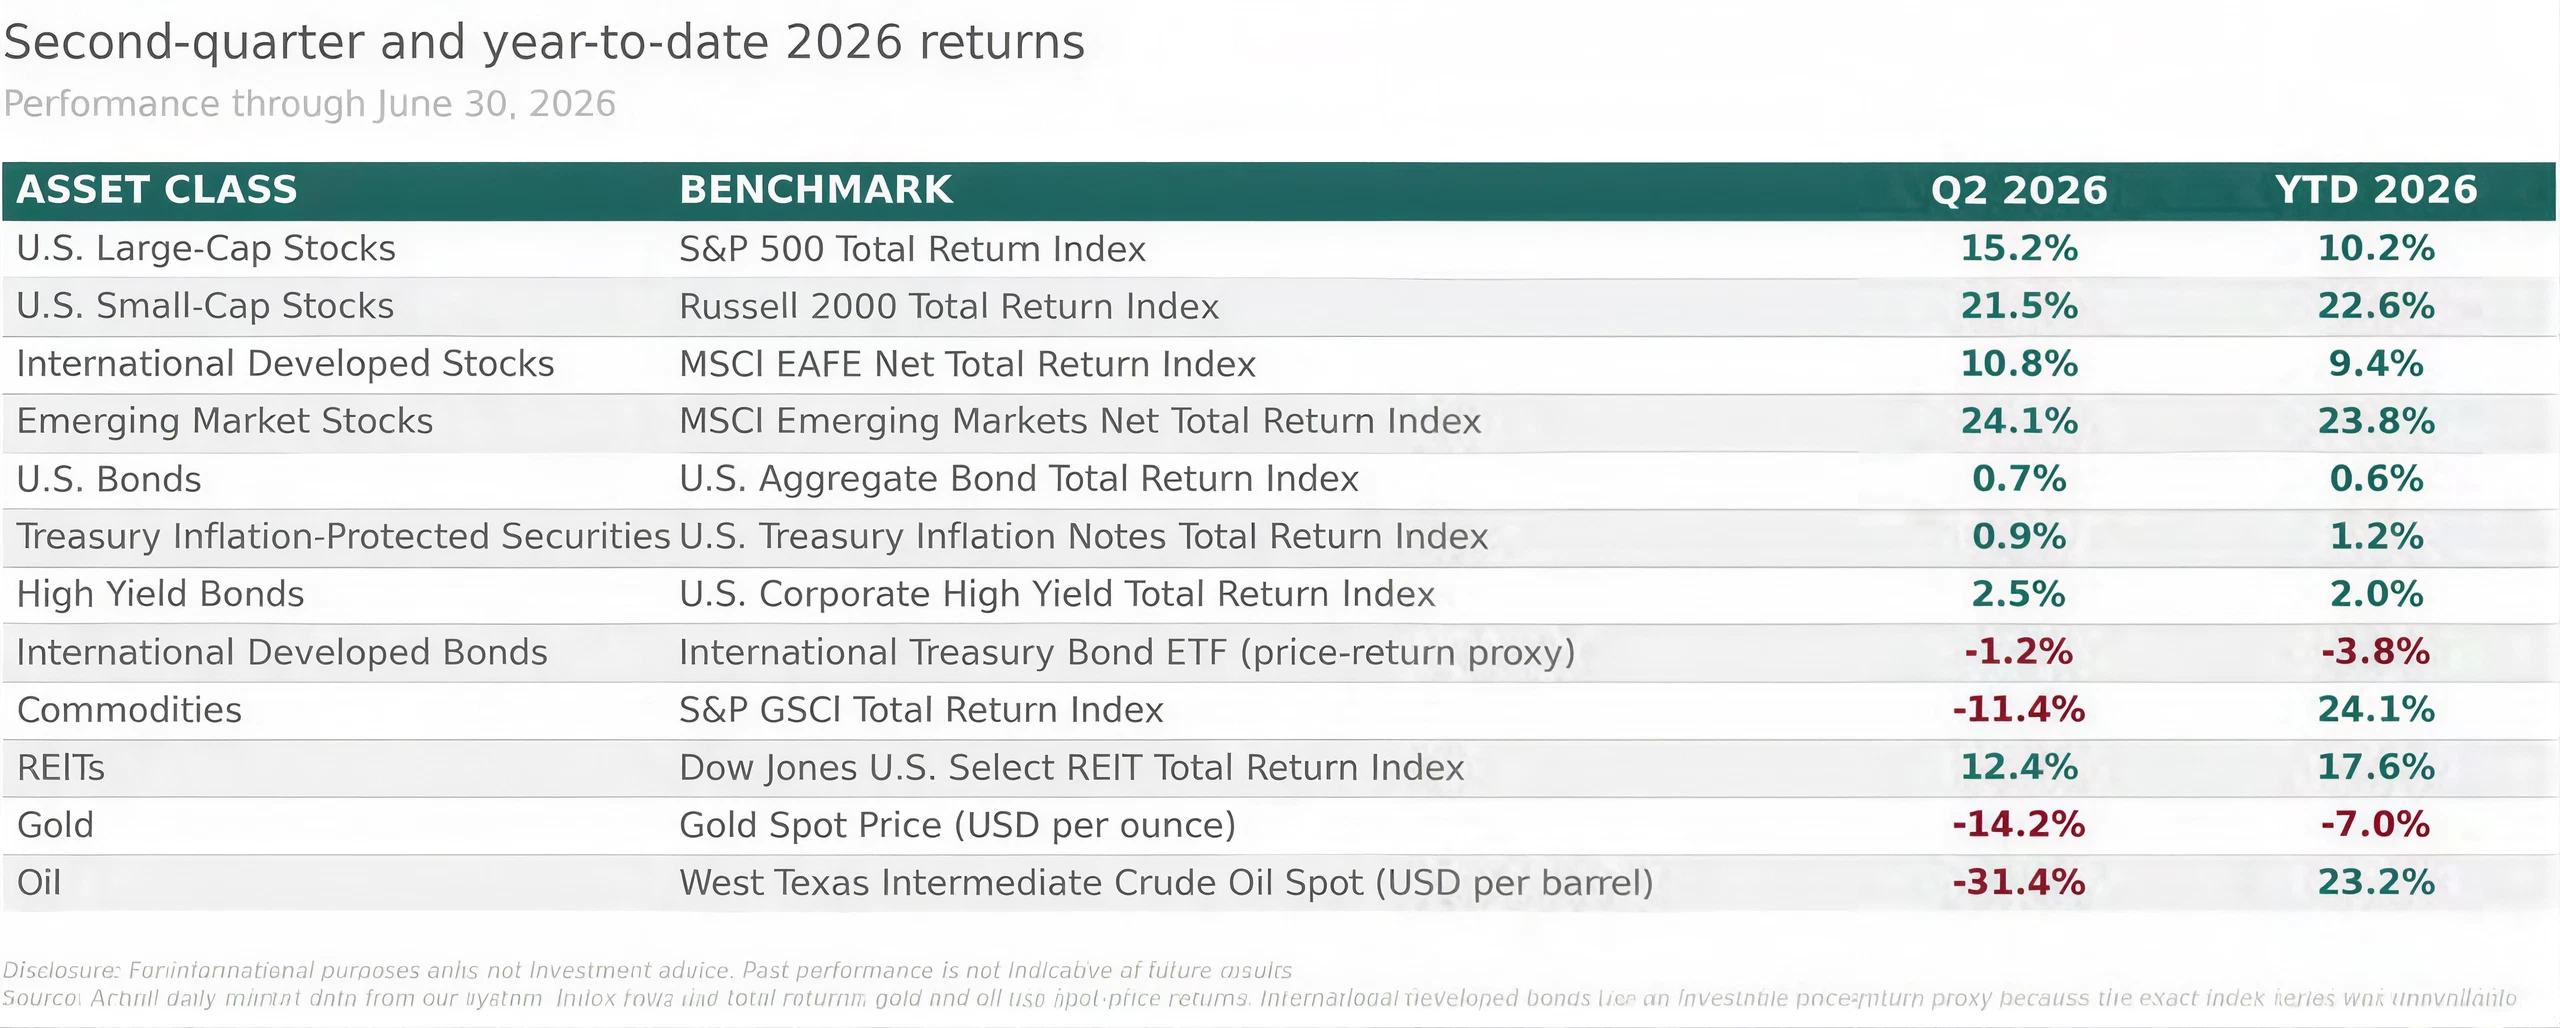
The following table highlights major asset-class returns during the second quarter and the first half of the year:
Asset-Class Performance
Some additional insights from the above table:
- The first half of the year rewarded almost everything except the market’s former leaders. While the S&P 500 gained a strong 10.2%, it was outperformed by small caps, emerging markets, REITs, and commodities. Other measures told the same story: value, mid-caps, small-cap value, dividend stocks, and the average S&P 500 stock all outperformed. This wasn’t a move away from equities—it was a broadening of the bull market beyond the handful of mega-cap stocks that have led in recent years.
- Small caps went from perennial laggard to the best-performing major U.S. equity asset class. The Russell 2000 index gained 22.6% during the first half of the year—more than twice the S&P 500’s return—and posted a remarkable 21.5% gain in the second quarter alone. Still, small caps remain the highest-risk version of the broadening trade: their earnings are more cyclical, they carry more floating-rate debt, and their performance is more sensitive to economic growth and financing conditions.
- Emerging markets ripped higher despite headwinds from a stronger dollar. Emerging-market stocks gained 23.8%, making them the best-performing equity category in the table. Technology-heavy markets like South Korea and Taiwan benefited from the widening AI investment cycle, while commodity-oriented markets also participated. That tech exposure runs deeper than many investors realize: the MSCI Emerging Markets index now carries roughly 45% in tech versus 37% for the S&P 500. International diversification is increasingly a sector allocation decision as well as a geographic one.
- Oil prices made a round trip. Despite falling 31% in the second quarter, oil still finished the first half of the year up 23% because its first-quarter rally was so dramatic. This is also a reminder that year-to-date returns can mask tremendous volatility beneath the surface.
- Gold failed precisely when many investors expected it to succeed. Gold declined 14.2% in the second quarter and finished the first half down 7.0%, despite renewed geopolitical conflict. A strengthening dollar and rising bond yields outweighed gold’s traditional safe-haven appeal. This is an important reminder that gold is not automatically a mechanical hedge against war or uncertainty. It tends to perform best when uncertainty is accompanied by falling real yields, currency weakness, or concern about the financial system—not just when headlines become more worrying.
- Bonds provided stability, but almost no return. The Bloomberg Aggregate Bond Index gained just 0.6% during the first half as inflation concerns and uncertainty surrounding the Fed kept Treasury yields elevated. Despite starting from much higher yields than a few years ago, bonds have yet to deliver the sustained rebound many investors anticipated.
First Half Market Performance Suggests The Rally Still Has Room To Run
The market staged a powerful reversal in the second quarter, and history suggests those reversals often have further to run. After falling 4% in the first quarter, the S&P 500 rallied 15% between April and June. Historically, years with a negative quarter followed by a double-digit rebound typically saw additional gains in the quarters ahead. Remarkably, this is already the fourth time the market has experienced this pattern during the 2020s (data for the next two charts from 3Fourteen):
Every Down-Then-Up Quarter Since 1950
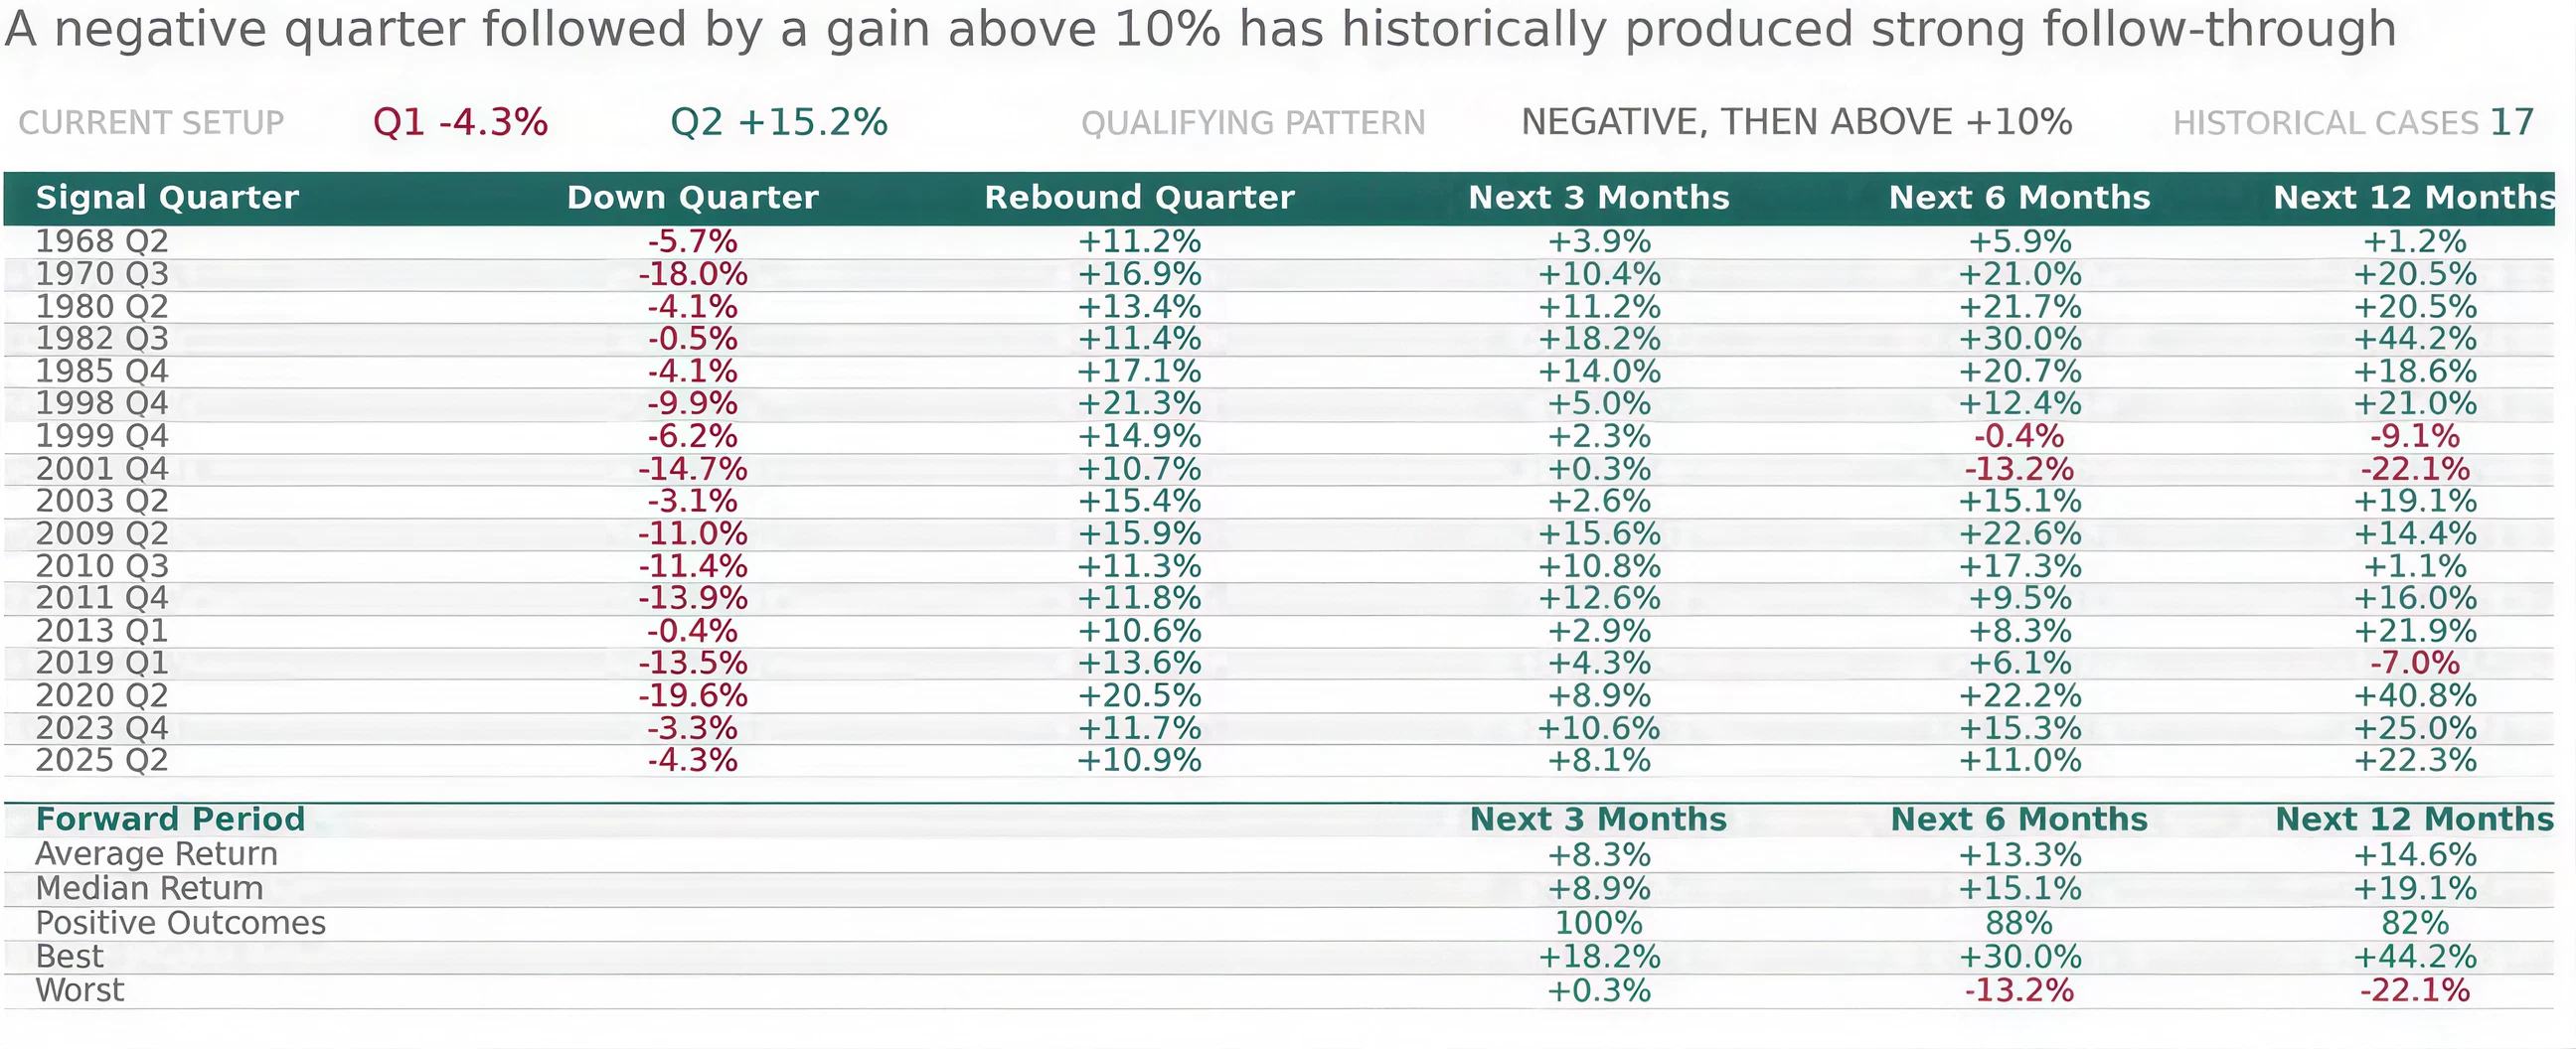
The exceptions are notable. While the market was generally higher over the following 3- and 6-month periods, there were three instances where the market was lower a year later. The first two cases occurred around the peak of the dot-com bubble and the 9/11 attacks. The most recent case occurred before the pandemic, when the rally stalled out in the first quarter of 2020 before recovering strongly for the next year and a half.
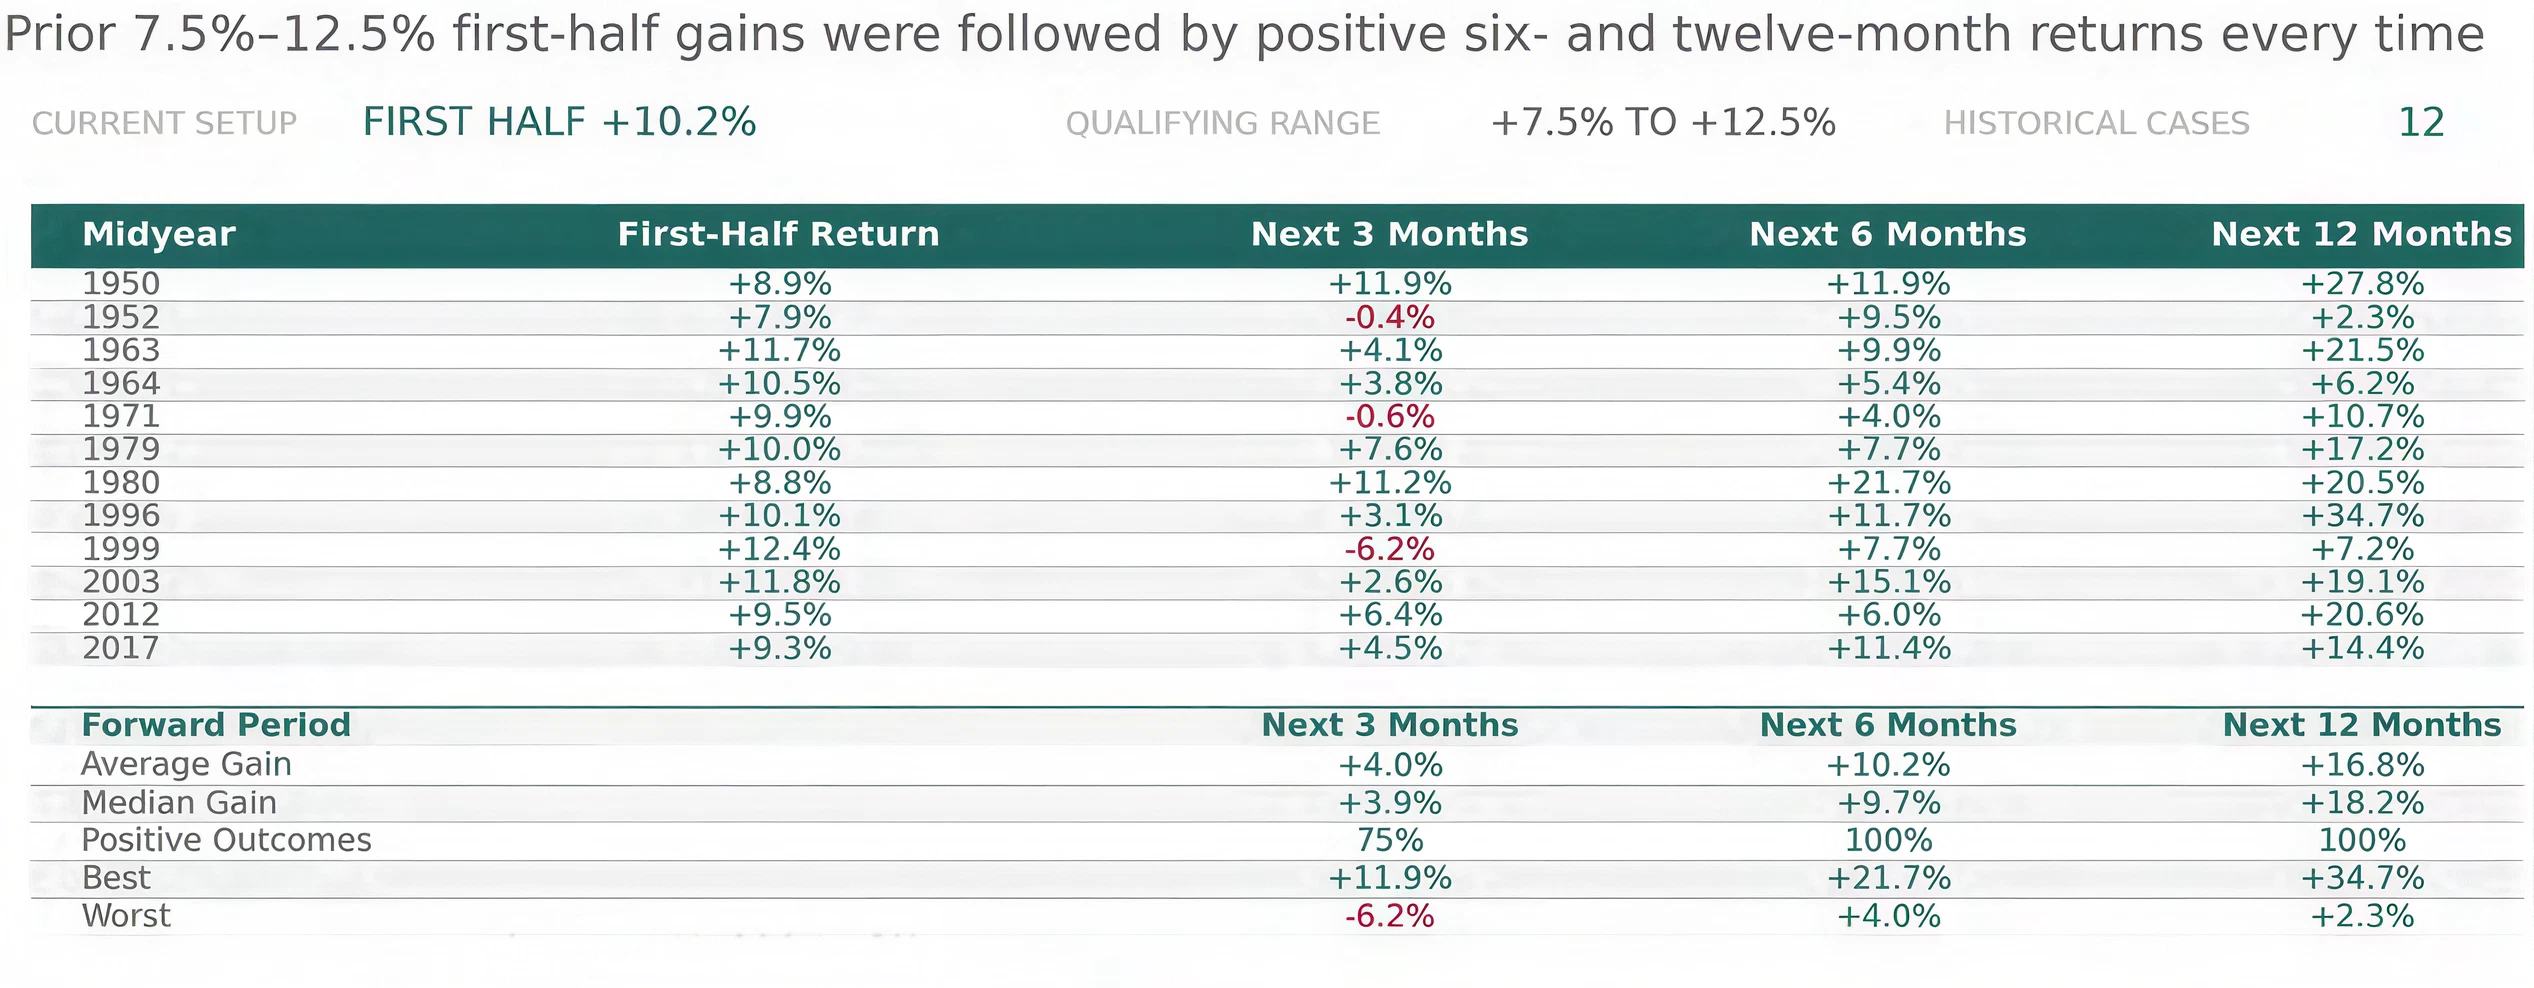
The strong second-quarter rebound isn’t the only encouraging sign. The market’s overall first-half return has also historically pointed to further upside. Whenever the S&P 500 was up between 7.5% and 12.5% through June, it finished the second half higher every time—a reminder that solid, but not euphoric, gains have typically been followed by more upside rather than signaling the rally has run its course.
Every Moderate First-Half Gain Since 1950
In summary, the first half of the year offered several reasons for optimism. The rally broadened beyond the Magnificent Seven, market leadership expanded across asset classes and sectors, and historical price patterns continue to support the case for further gains. Valuations remain elevated, but the evidence still falls short of the speculative extremes that have historically preceded major market tops. As always, we’ll continue to monitor the data and adjust our outlook and positioning as the evidence changes.
Important Disclosures
Corbett Road Capital Management, LLC (“Corbett Road”) is a federally registered investment advisor with the Securities Exchange Commission (“SEC”) and has been in business since 2019. Registration with the SEC does not imply their approval or endorsement of any service provided by Corbett Road. This presentation contains information based on the views of Corbett Road. Other organizations or persons may analyze investments and the approach to investing from a different perspective than that reflected in this presentation. Nothing included herein is intended to infer that the approach to investing discussed in this presentation will assure any particular investment results.
Nothing in this presentation is to be considered investment advice and should not be relied upon as the basis for entering any transaction or advisory relationship or making any investment decision. All investments involve the risk of loss, including the loss of principal. Performance information included on this presentation is solely to demonstrate the potential benefits historically associated with commercial asset classes. Past performance is not an indicator of future results.
Charts and graphs depicted in this presentation are for educational purposes only. Investors cannot invest in a market index directly, and the performance of an index does not represent any actual transactions. The performance of an index does not include the deduction of various fees and expenses which would lower returns. Advisory fees charged to Corbett Road clients, whether directly or indirectly through an ETF, are described in Corbett Road’s Form ADV Part 2A and Form CRS, available at https://adviserinfo.sec.gov/firm/summary/305063. Past performance is no guarantee of future results.
The presentation includes data, graphs, charts, or other material reflecting the performance of a security, an index, an investment vehicle, a composite or other instrument over time (“Performance Material”). Past performance, and any performance reflected in Performance Material, is not an indication of future results.
All information is based on sources deemed reliable, but no warranty or guarantee is made as to its accuracy or completeness. macrocast™ and microcast™ are proprietary indexes used by Corbett Road Wealth Management to help assist in the investment decision-making process. Neither the information provided by macrocast™ or microcast™ nor any opinion expressed herein considers any investor’s individual circumstances nor should it be treated as personalized advice. Individual investors should consult with a financial professional before engaging in any transaction or strategy. The phrase “the market” refers to the S&P 500 Total Return Index unless otherwise stated. The phrase “risk assets” refers to equities, REITs, high yield bonds, and other high volatility securities.
Use of Indicators
Corbett Road’s quantitative models utilize a variety of factors to analyze trends in economic conditions and the stock market to determine asset and sector allocations that help us gauge market movements in the short- and intermediate term. There is no guarantee that these models or any of the factors used by these models will result in favorable performance returns.
