Summary
Several industries, led by software, have sold off significantly year-to-date, as investors assess the impact of artificial intelligence on established business models. While some companies will face genuine pressure, the initial market response is often indiscriminate pricing in disruption broadly before fully understanding the scope and timing of new innovations. Over time, the market will distinguish between structural losers and firms that successfully adapt and continue to grow.
While the cap-weighted S&P 500 has stalled due to weakness in Big Tech, capital is rotating into cyclicals, value, and international equities. Improving breadth has historically been constructive for forward returns, and pullbacks at this stage should be viewed in the context of a healthy rotation rather than a market breakdown.
A positive January has typically been followed by strong full-year performance for equities. When the year started with modest gains (up 1-2%), forward returns were positive in every prior instance.
Our current microcast™ signal remains at an aggressive allocation, unchanged from last month’s stance. Overall, our tactical risk models continue to reflect a constructive outlook for equity markets.
Concerns About AI Disruption Are Upending Several Industries
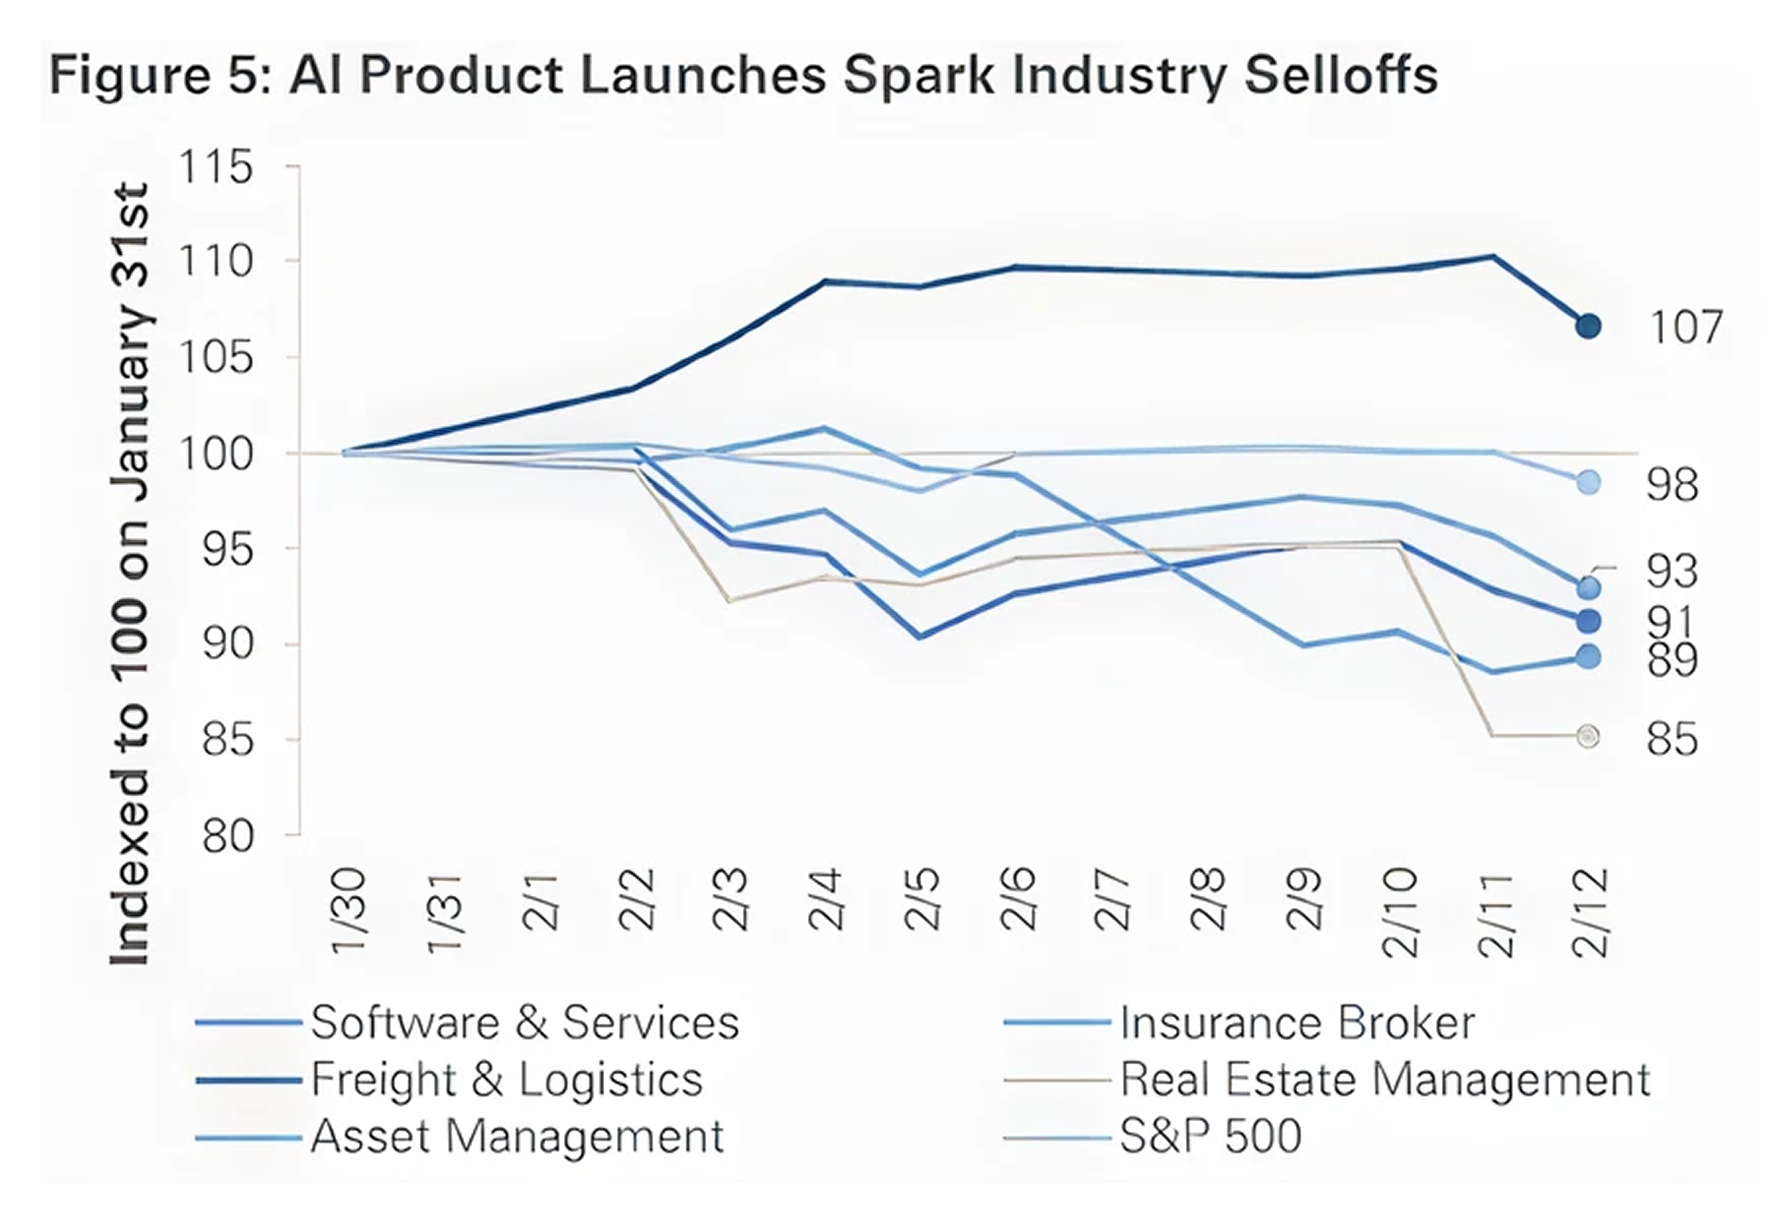
Stocks in several industries have sold off sharply on fears that AI will erode their business models. Software has been the most visible casualty, but the pressure has extended to insurance brokers, commercial real estate providers, and even trucking companies (chart from MarketDesk):
The reaction in software is understandable. These businesses generate high margins and recurring subscription revenue. The durability and visibility of their business models have long justified premium valuations. If AI compresses pricing power, lowers barriers to entry, or shifts value away from incumbent platforms, the economics begin to look less secure. When an industry built on high margins and predictable revenue starts to appear structurally vulnerable, valuation multiples reset quickly, even if the companies themselves remain profitable. It’s also worth noting that this rerating didn’t start with the latest wave of AI headlines. Software forward price to earnings (P/E) ratios peaked in early 2022 and have been compressing ever since (chart from Bloomberg):

Investors may be repeating a familiar pattern. When GLP-1 drugs like Wegovy and Zepbound began gaining traction in late 2023, markets quickly priced in second-order effects. Packaged food companies sold off on the assumption that decreased appetite would reduce snacking. Insulin providers and kidney care companies declined as well, given the drugs’ origins in diabetes treatment and early studies pointing to improved kidney outcomes.
The underlying question then (as now) was how much of the perceived disruption would actually materialize, and how quickly.
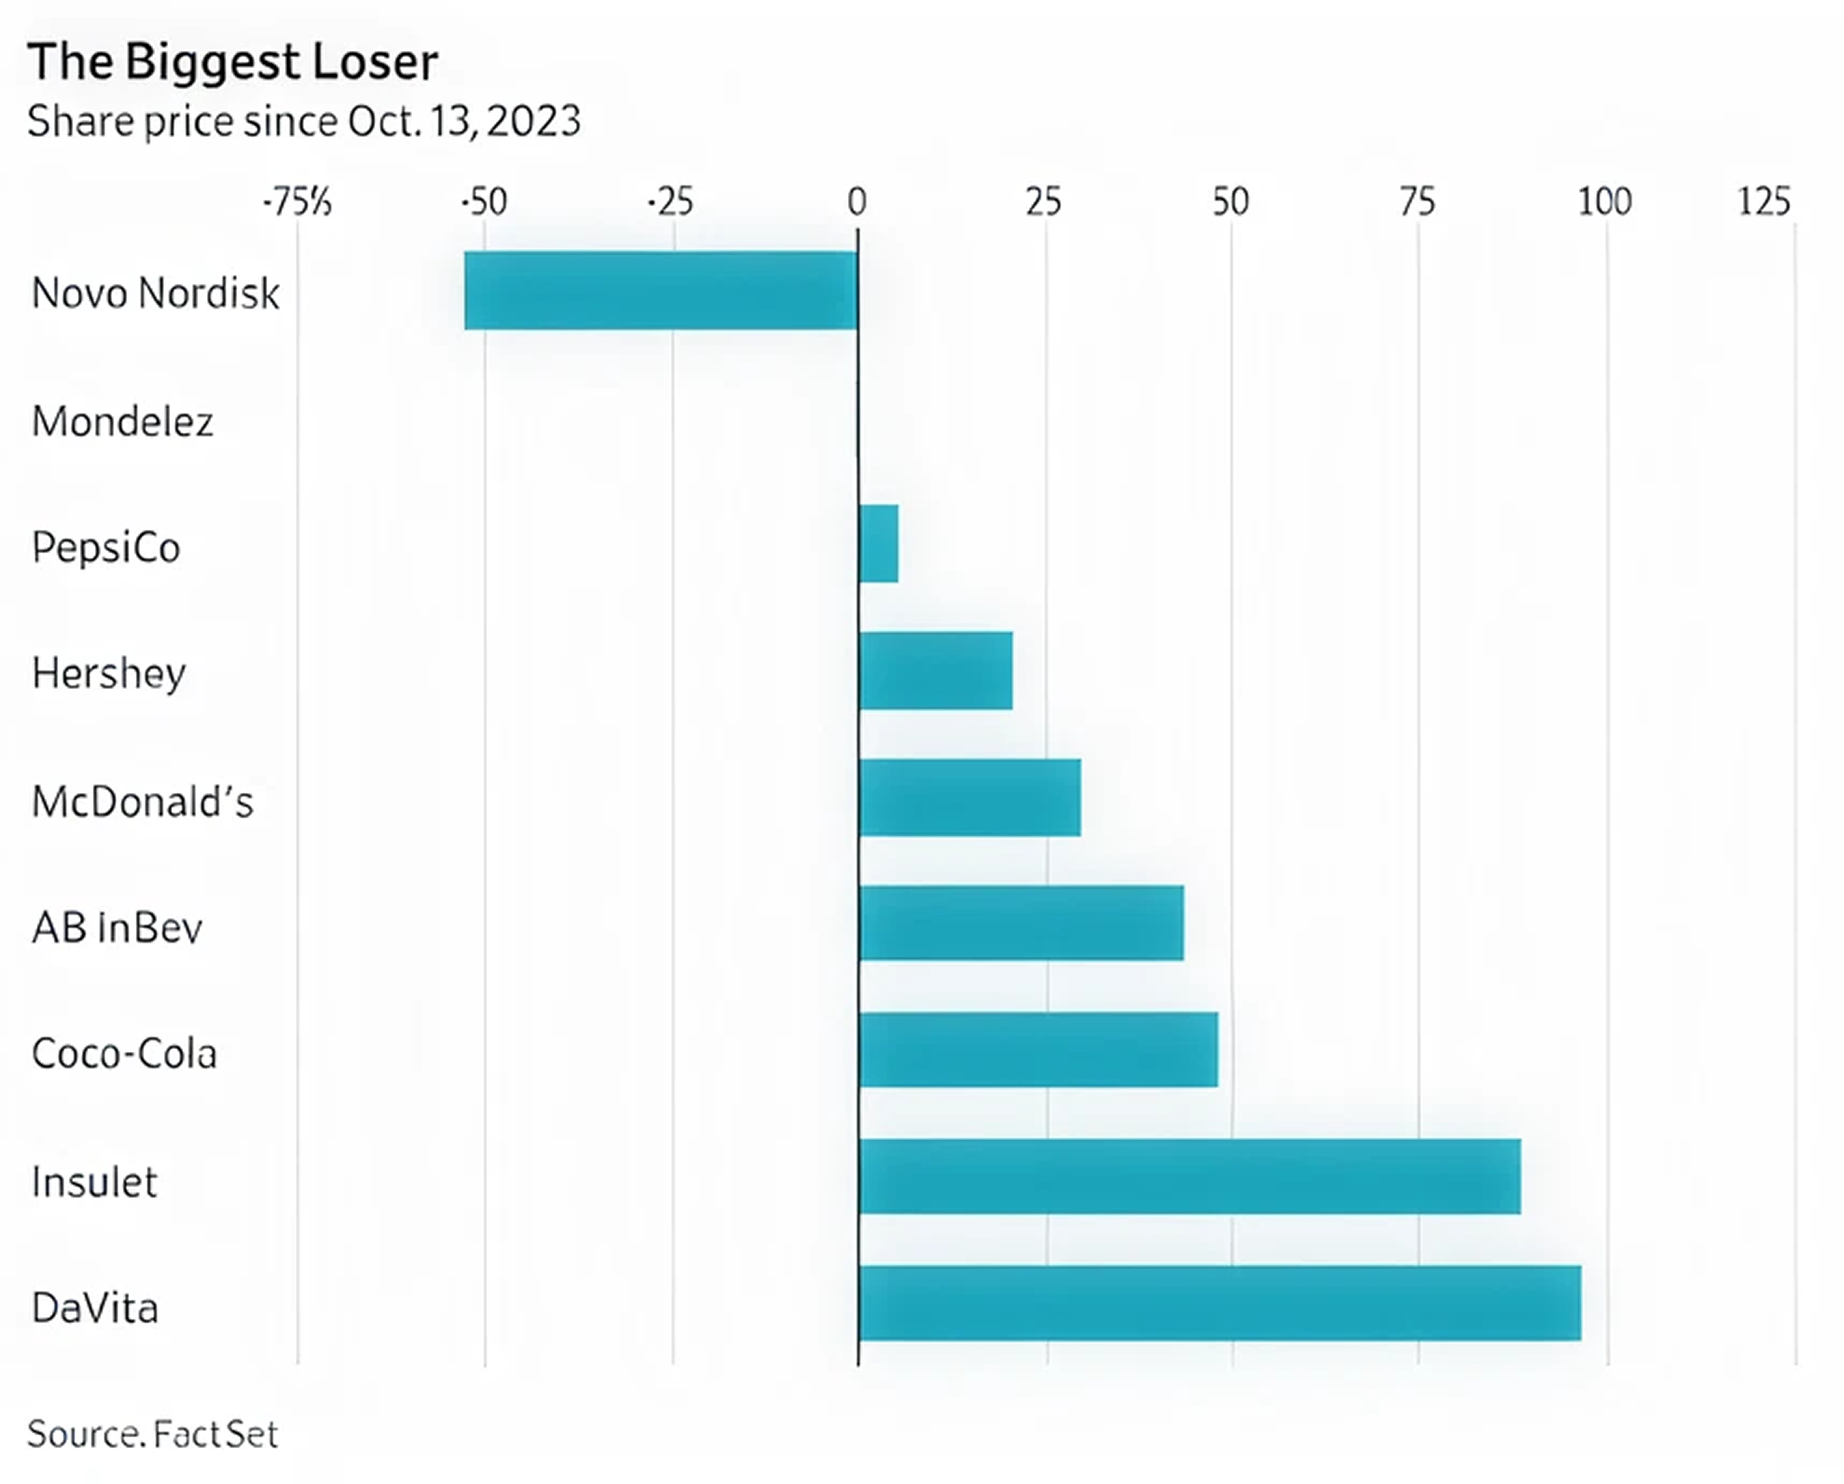
Reviewing the GLP-1 landscape today, share performance looks very different from the initial reaction and what was expected two years ago. The steepest drawdown has occurred in shares of Novo Nordisk (maker of Wegovy), which have declined nearly 50% from peak. Meanwhile, many of the companies that initially sold off due to “GLP-1 risk” have recovered as the initial pessimism proved excessive.
Markets moved ahead of the data, pricing in disruption before its scale and timing were clear (chart from WSJ):
A similar outcome is not assured with AI. Some business models will face real pressure.
Over time, though, markets tend to draw distinctions. Companies that are structurally vulnerable will likely not recover, while those that adapt, protect margins, and continue to grow will regain their footing. The process can be uneven and lead to further volatility, but investors rarely treat all companies within an industry the same indefinitely.
Despite Some Disruption, The Broader Market Remains Constructive
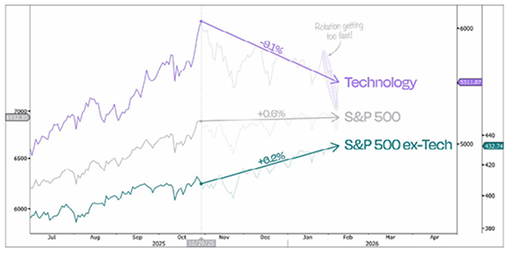
The stock market, as measured by the S&P 500, has not made much progress since last October. However, this is largely due to the index’s outsized exposure to technology stocks, which have recently underperformed, masking steady gains in other sectors (chart from Duality Research):
Today’s leading AI companies are far more profitable than the average tech firm in 1999. Their valuations are underpinned by real earnings, healthy margins, and strong free cash flow. And while prices have certainly risen, they remain well below the extremes seen in past bubbles. The table below, from Goldman Sachs, compares the index weightings and forward P/E ratios to the peak of the dotcom bubble in the year 2000, as well as a couple of other well-known speculative peaks over the past 50 years:
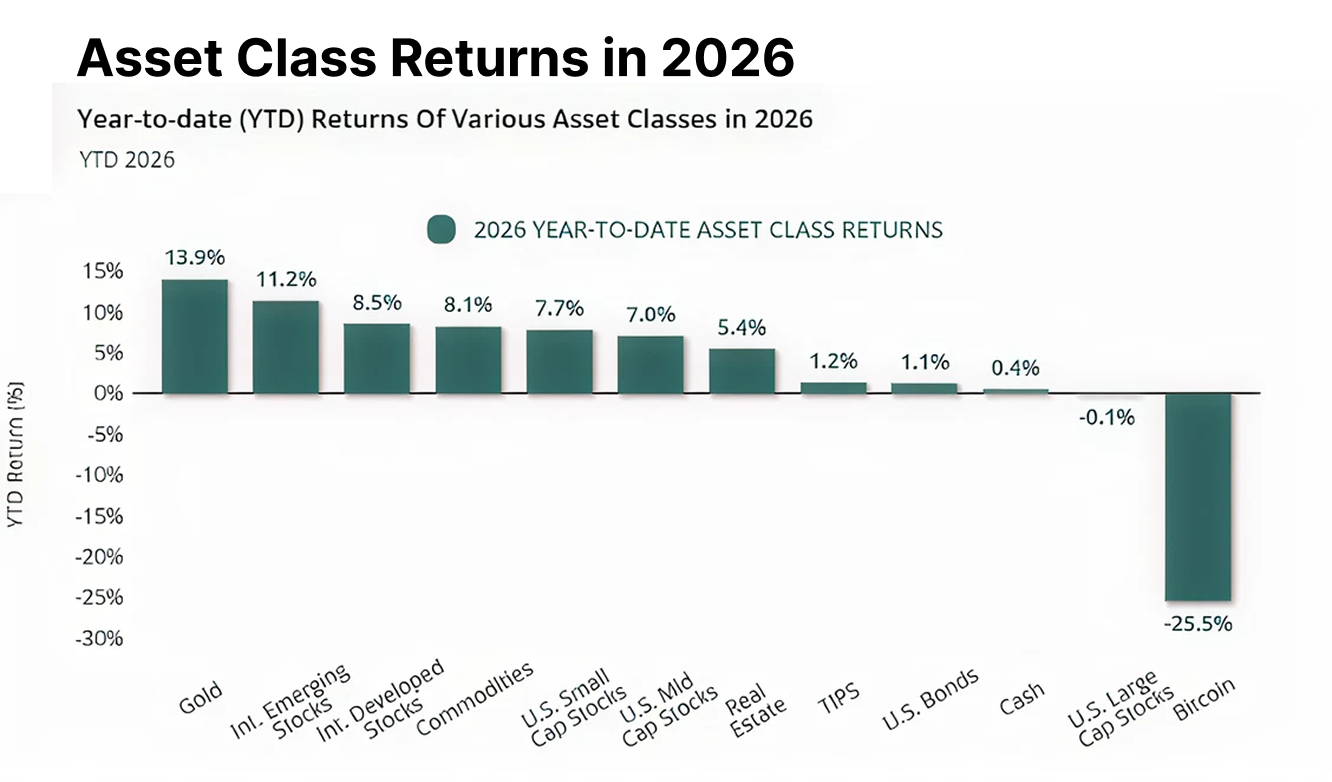
As leadership has shifted away from Big Tech, capital has flowed into cyclicals and value stocks. International equities, both developed and emerging, are again leading the way in 2026 as they did last year (from Exhibit A, data through 2/12/2026):
Taken together, this resembles a healthy rotation, not a breakdown. Leadership is broadening beyond Big Tech, which reduces the concentration risk that has grown increasingly extreme as these mega-cap tech stocks drove the bulk of the market’s gains in recent years.
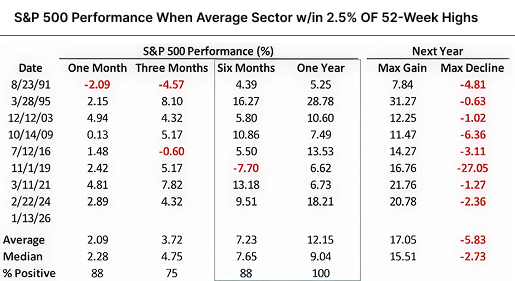
History supports the idea that improving breadth is constructive. When the average S&P 500 sector was within 2.5% of its 52-week high, forward one-year returns for the index were positive every time (chart from Bespoke):
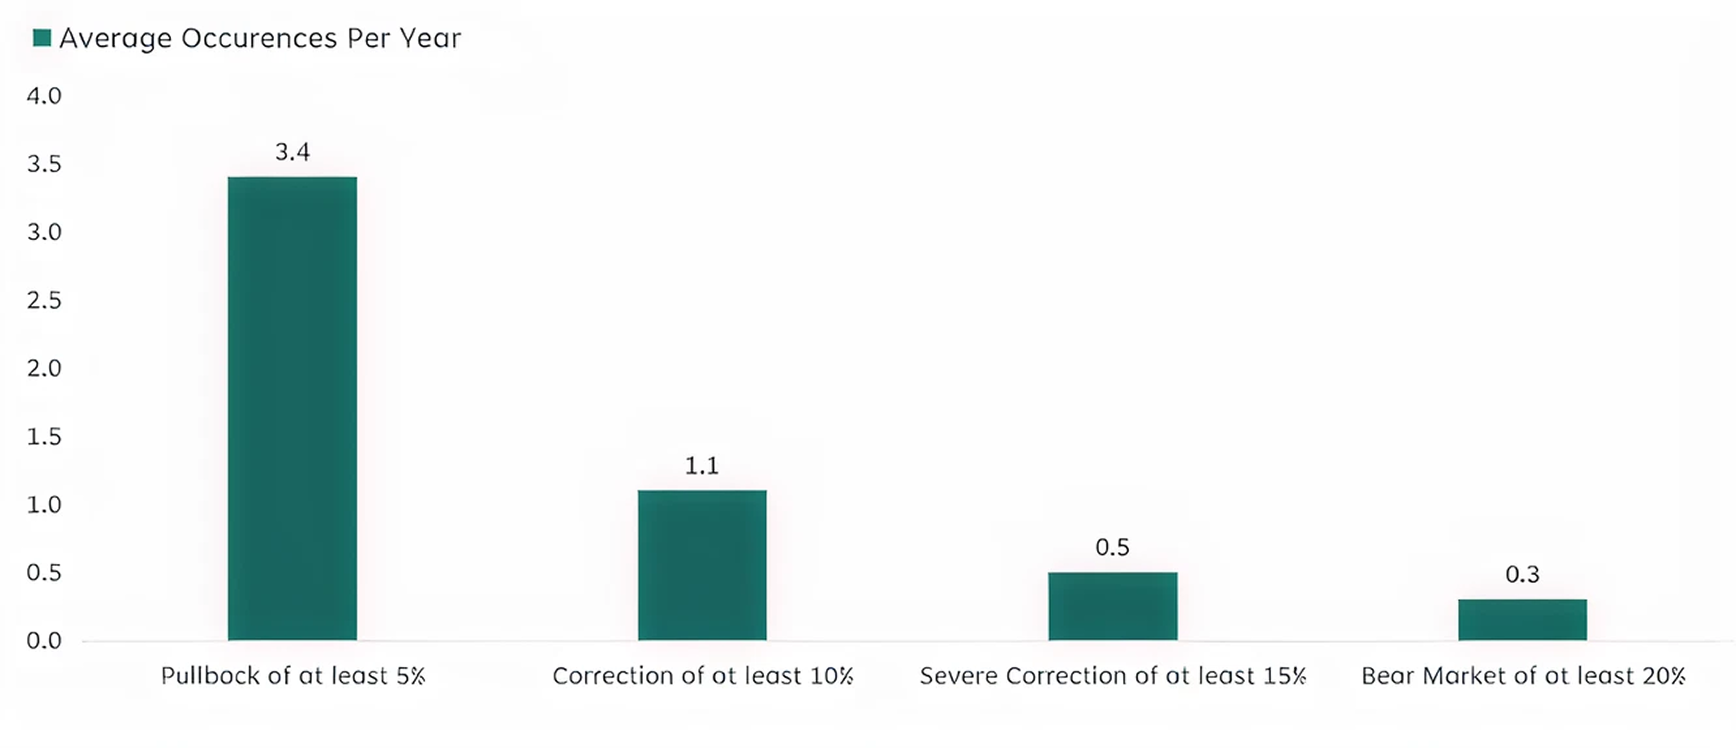
While improving breadth and more diversified leadership are constructive developments for forward returns, pullbacks of 5-10% are still a regular feature of equity markets. On average, the market experiences roughly three declines of at least 5% each year and one decline of 10% or more.
For context, 2025 saw an 18% correction during the April tariff scare, followed by another 5% pullback in November (chart from LPL):
January Barometer Points To A Positive Year For Stocks
The January Barometer is a stock market theory that suggests January’s performance can predict the market’s direction for the rest of the year. The phrase “as goes January, so goes the year,” sums up this idea.
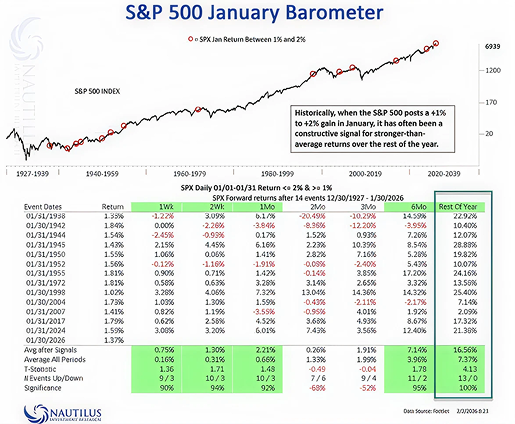
Comparing the average returns in both scenarios, there is evidence that a positive January has been a reliable market indicator. Historically, when the market was up in January, average returns for the full year were significantly greater than when the year started off with a decline (chart from Exhibit A):

Furthermore, a modest January gain has historically set a constructive tone for the rest of the year. When the S&P 500 rises between 1% and 2% in January, February through December have seen average returns around 16%. In the 13 prior instances shown, the index finished the year higher each time (chart from Nautilus Research):
Important Disclosures
Corbett Road Capital Management, LLC (“Corbett Road”) is a federally registered investment advisor with the Securities Exchange Commission (“SEC”) and has been in business since 2019. Registration with the SEC does not imply their approval or endorsement of any service provided by Corbett Road. This presentation contains information based on the views of Corbett Road. Other organizations or persons may analyze investments and the approach to investing from a different perspective than that reflected in this presentation. Nothing included herein is intended to infer that the approach to investing discussed in this presentation will assure any particular investment results.
Nothing in this presentation is to be considered investment advice and should not be relied upon as the basis for entering any transaction or advisory relationship or making any investment decision. All investments involve the risk of loss, including the loss of principal. Performance information included on this presentation is solely to demonstrate the potential benefits historically associated with commercial asset classes. Past performance is not an indicator of future results.
Charts and graph depicted in this presentation are for educational purposes only. Investors cannot invest in a market index directly, and the performance of an index does not represent any actual transactions. The performance of an index does not include the deduction of various fees and expenses which would lower returns. Advisory fees charged to Corbett Road clients, whether directly or indirectly through an ETF, are described in Corbett Road’s Form ADV Part 2A and Form CRS, available at https://adviserinfo.sec.gov/firm/summary/305063. Past performance is no guarantee of future results.
The presentation includes data, graphs, charts, or other material reflecting the performance of a security, an index, an investment vehicle, a composite or other instrument over time (“Performance Material”). Past performance, and any performance reflected in Performance Material, is not an indication of future results.
All information is based on sources deemed reliable, but no warranty or guarantee is made as to its accuracy or completeness. macrocast™ and microcast™ are proprietary indexes used by Corbett Road Wealth Management to help assist in the investment decision-making process. Neither the information provided by macrocast™ or microcast™ nor any opinion expressed herein considers any investor’s individual circumstances nor should it be treated as personalized advice. Individual investors should consult with a financial professional before engaging in any transaction or strategy. The phrase “the market” refers to the S&P 500 Total Return Index unless otherwise stated. The phrase “risk assets” refers to equities, REITs, high yield bonds, and other high volatility securities.
Use of Indicators
Corbett Road’s quantitative models utilize a variety of factors to analyze trends in economic conditions and the stock market to determine asset and sector allocations that help us gauge market movements in the short- and intermediate term. There is no guarantee that these models or any of the factors used by these models will result in favorable performance returns.